Learn how residential proxies work, from ISP-assigned IP routing and backconnect gateways to session management and why sites can't detect them.
The Network Architecture Behind Residential Proxies
Residential proxies route your traffic through IP addresses that Internet Service Providers have assigned to real households and mobile devices. Datacenter proxies originate from cloud hosting infrastructure. Residential proxies don't. Every residential proxy request exits through an IP a regional ISP handed to an actual subscriber line: DSL, fibre, cable, or wireless.
This distinction isn't cosmetic. It changes how target servers classify incoming requests at the most fundamental level.
To understand how residential proxies work, you have to look at several layers: how IPs get acquired, how requests get routed, which connection protocols are supported, how sessions are managed, and how IP classification systems make residential traffic blend in with organic users. Each layer solves a specific technical problem in making proxy traffic indistinguishable from regular browsing.
How ISPs Assign Residential IP Addresses
ISPs receive blocks of IP addresses from Regional Internet Registries: ARIN in North America, RIPE NCC in Europe, APNIC in Asia-Pacific, and so on. These allocations are registered under Autonomous System Numbers (ASNs) that identify the ISP as a network operator. When a subscriber plugs in their home router, the ISP's DHCP server assigns an IP from that allocated pool.
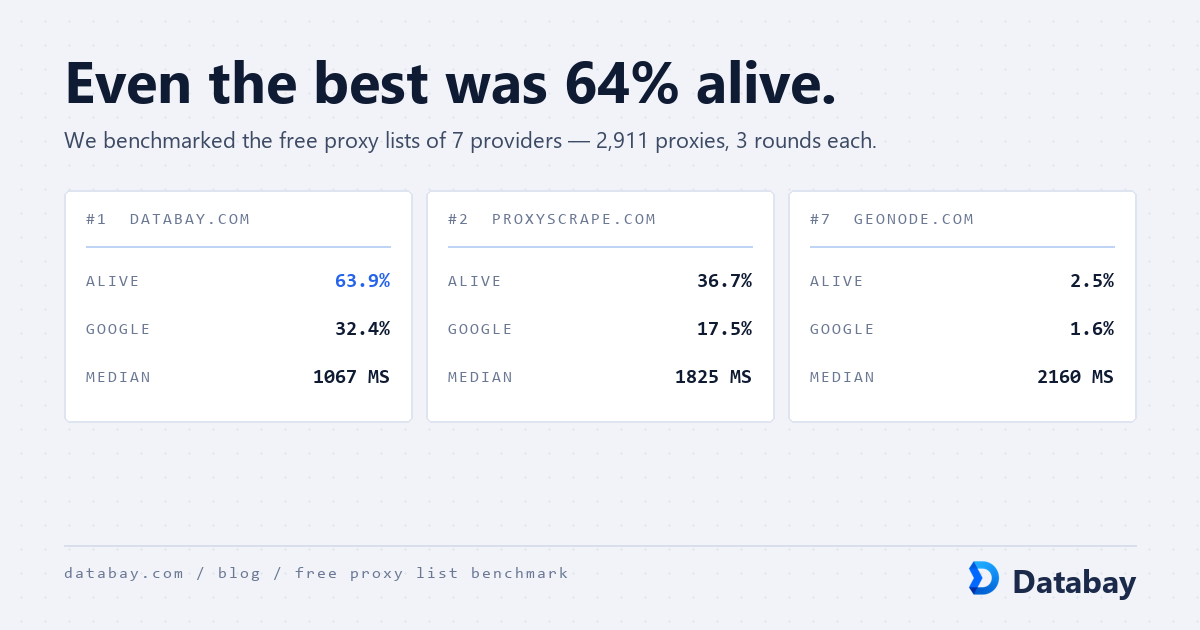
This creates a verifiable chain of trust. IP intelligence databases like MaxMind, IP2Location, and Digital Element cross-reference WHOIS records, BGP routing tables, and ASN registrations to classify every IP. An IP assigned under Comcast's ASN 7922 or Deutsche Telekom's ASN 3320 gets tagged as 'residential' or 'ISP', not 'hosting' or 'datacenter.' Anti-bot systems check that classification first when they evaluate a request.
Most residential ISPs use dynamic IP assignment. Subscriber IPs rotate periodically, usually every 24 to 72 hours, or whenever the router reconnects. That natural churn is actually useful for proxy networks. It keeps the pool refreshed with addresses that carry clean usage histories.
How Proxy Providers Build Residential Networks
Residential proxy providers don't own the IPs they offer. They aggregate them through partnerships and SDK integrations with application developers. The most common model: a free app (VPN, utility, content tool) embeds the proxy provider's SDK. Users who install the app opt in to share their idle bandwidth and IP address in exchange for the free service. When the device is on Wi-Fi and idle, the SDK opens a lightweight tunnel back to the provider's infrastructure.
This peer-to-peer model scales to millions of IPs because it piggybacks on real consumer internet connections across hundreds of ISPs and thousands of cities. An established provider like Databay maintains pools exceeding 34 million residential IPs exactly because SDK-based acquisition reaches devices across virtually every geography and ISP.
Ethical, compliant providers require explicit user consent, disclose bandwidth sharing in app permissions, and cap resource usage so the host device's performance stays intact. The SDK usually throttles bandwidth, pauses during active device use, and respects battery and metering constraints on mobile connections.
Request Routing: From Client to Target
The routing pipeline for a residential proxy request involves several hops, each with a distinct job. Here's the full flow:
- Client application. Your scraper, browser, or HTTP client sends a request to the proxy gateway endpoint (e.g., gw.databay.co:port).
- Backconnect gateway. The provider's gateway server receives the request, authenticates your credentials, parses targeting parameters (country, city, session ID), and picks a residential node from the pool.
- Residential peer node. The SDK on the selected device receives the request through the tunnel, forwards it to the target server using the device's native internet connection, and returns the response.
- Response relay. The response travels back through the tunnel to the gateway, which relays it to your client.
From the target server's perspective, the request originates from the residential device's IP. The server sees an incoming connection from, say, a Verizon FiOS subscriber in Chicago, not a cloud server in a data centre. The proxy infrastructure between your client and the residential node is invisible to the target.
Backconnect Gateway Architecture
The backconnect gateway is the piece that makes residential proxy networks scalable. Rather than assigning you a static residential IP (which would mean maintaining persistent connections to specific devices), the gateway acts as a dynamic load balancer across the entire pool.
You connect to a single gateway endpoint. On each request, or per session depending on configuration, the gateway routes your traffic through a different residential node. That's why the term 'backconnect' is used: the residential nodes connect back to the gateway infrastructure, maintaining persistent outbound tunnels that the gateway can route traffic through on demand.
The gateway handles connection multiplexing, queuing, failover (if a residential node drops mid-request, the gateway retries through another node), geographic targeting, and session affinity. High-performance gateways track real-time health metrics for every connected node, latency, throughput, error rates, and use weighted routing algorithms to optimise for speed and reliability.
Connection Protocols: HTTP CONNECT and SOCKS5
Residential proxies carry traffic through two primary protocols: HTTP/HTTPS via the CONNECT method and SOCKS5.
HTTP CONNECT is the common approach. Your client sends a CONNECT request to the proxy gateway specifying the target host and port. The gateway establishes a TCP tunnel through the residential node to the target, and from there, raw bytes flow bidirectionally. For HTTPS traffic, the TLS handshake occurs end-to-end between your client and the target server. The proxy infrastructure never sees decrypted content. That's both a privacy feature and a technical necessity, since the proxy can't modify encrypted payloads.
SOCKS5 operates at a lower level. It proxies arbitrary TCP (and optionally UDP) traffic without being HTTP-aware. That makes SOCKS5 useful for non-HTTP cases: custom protocols, database connections, or any TCP-based communication that needs to exit through a residential IP. SOCKS5 also supports authentication natively and can resolve DNS on the proxy side, preventing DNS leaks that might expose the client's real location.
Most modern residential proxy services support both protocols on the same gateway, differentiated by port number or protocol negotiation.
Session Management: Sticky vs Rotating
How residential proxies work in practice depends heavily on session configuration. Providers offer two basic modes:
Rotating sessions assign a new residential IP for every request. Each HTTP call exits through a different node in the pool. This maximises anonymity and spreads traffic across the widest possible IP surface. Rotating sessions suit large-scale data collection where each request is independent: search engine scraping, price monitoring across thousands of product pages, or ad verification across different geos.
Sticky sessions keep the same residential IP for a defined window, typically configurable from 1 minute to 30 minutes or more. Your requests pin to a specific node as long as it remains available and the session TTL hasn't expired. Sticky sessions are essential when you need IP continuity: logging into a website, completing multi-page checkout flows, maintaining authenticated sessions, or running sequential operations that a target site expects to come from the same IP.
Session control usually comes through request parameters, either as a session ID in the proxy username (e.g., user-session-abc123) or as a custom header. The gateway uses that identifier to route all requests with the same session ID to the same residential node.
ASN Classification and IP Intelligence
The core advantage of residential proxies comes down to how IP intelligence databases classify addresses. Every IP block on the internet is registered under an ASN, and those ASNs are categorised by type:
- ISP / Residential ASNs. Assigned to consumer internet providers (Comcast, AT&T, BT, Orange). IPs under these ASNs are trusted by default because they represent real users.
- Hosting / Datacenter ASNs. Assigned to cloud providers and hosting companies (AWS, Google Cloud, OVH, Hetzner). Traffic from these ASNs gets heightened scrutiny because legitimate consumers rarely browse from data centres.
- Enterprise ASNs. Assigned to corporations with their own IP allocations. Generally trusted, sometimes flagged for unusual patterns.
Anti-bot platforms like Akamai, Cloudflare, PerimeterX, and DataDome query IP intelligence feeds as their first detection layer. When a request arrives from an IP classified as residential, it clears that initial check automatically. The request still faces behavioural analysis, fingerprinting, and rate-limit evaluation, but it gets past the single most decisive filter, the one that outright blocks datacenter traffic on many protected sites.
Why Target Sites Can't Easily Detect Residential Proxy Traffic
Residential proxies are hard to detect because the traffic is genuinely indistinguishable from organic users at the network level. Residential proxies route traffic through real ISP-assigned IP addresses, which means requests look exactly like regular home internet users. The IP passes WHOIS lookups, ASN checks, and geolocation verification because it actually belongs to a real ISP subscriber in a real location.
Several technical factors compound this:
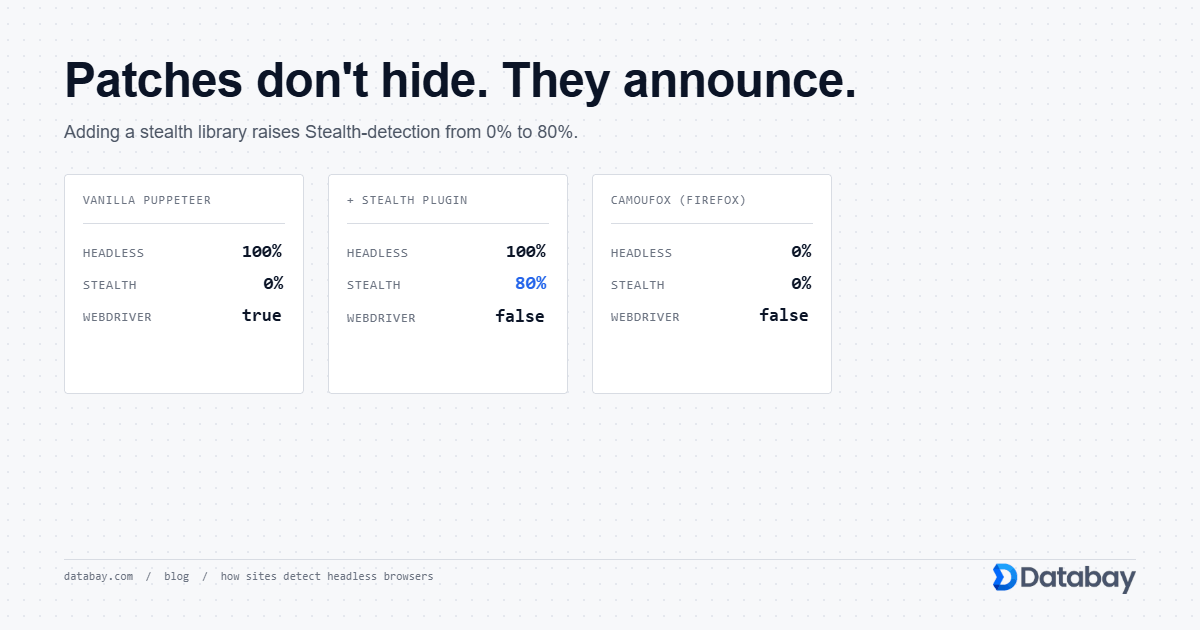
- TCP/IP fingerprint. The TCP stack behaviour (window size, TTL, MSS, options ordering) reflects the residential device's operating system, not a server OS. A request from an Android phone on T-Mobile exhibits the same TCP characteristics as any other T-Mobile Android user.
- Geolocation consistency. The IP's geographic location matches the ISP's service area. There's no discrepancy between the IP's registered location and its actual routing path, which is what commonly trips up VPNs and datacenter proxies.
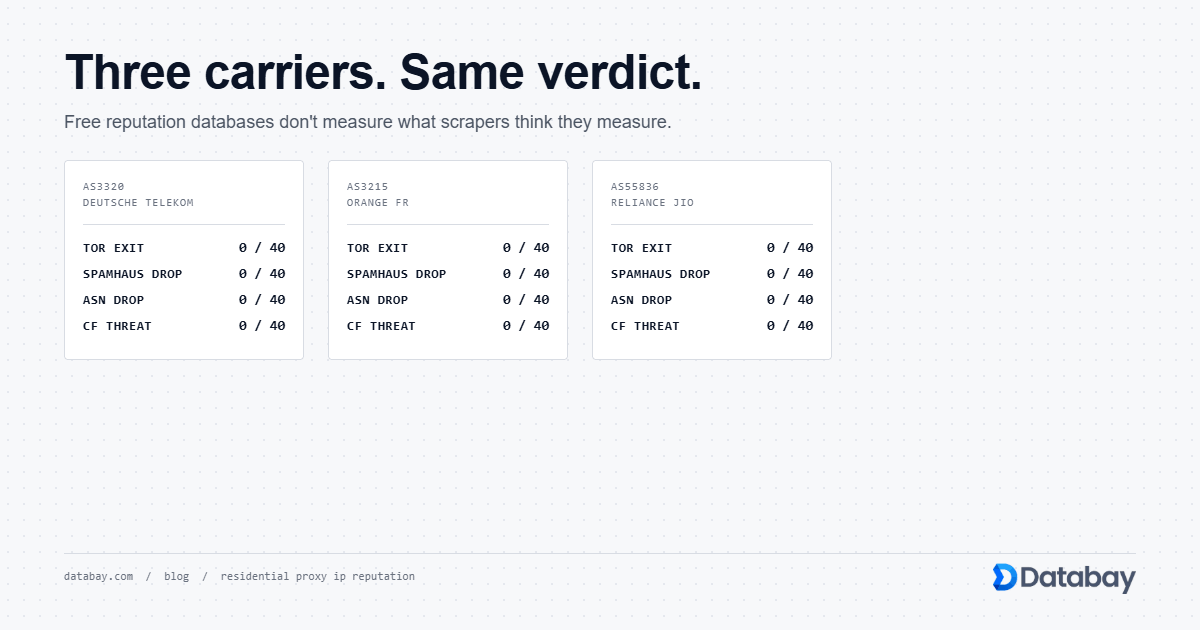
- IP reputation. Residential IPs carry low-risk scores in threat intelligence databases because they're associated with normal consumer activity, not server infrastructure.
- Network diversity. A pool of millions of residential IPs across thousands of ISPs and subnets means no two consecutive requests need to share the same network block, so subnet-level blocking fails.
Detection systems would have to rely entirely on behavioural analysis, request timing, browsing patterns, header consistency, which is significantly more complex and error-prone than IP-level classification.
Latency Considerations and Performance Tuning
Residential proxies inherently add latency compared to datacenter proxies. The request takes more hops: client to gateway, gateway to residential node (over the SDK tunnel), residential node to target, and the reverse path for the response. The residential node's own internet connection, which might be a 50 Mbps home cable line or a 4G mobile connection, becomes the bottleneck.
Typical latency for residential proxies falls between 500ms and 3 seconds per request, compared to 100-500ms for datacenter proxies. Several techniques reduce that impact:
- Geographic targeting. Picking residential nodes close to the target server cuts round-trip distance. A US residential IP scraping a US-hosted site avoids trans-oceanic hops.
- Connection reuse. HTTP keep-alive and persistent connections to the gateway eliminate the overhead of repeated TCP handshakes and TLS negotiations.
- Concurrency over speed. Instead of optimising individual request speed, run many concurrent requests through different residential nodes. Aggregate throughput can be very high even if per-request latency is moderate.
- Node quality filtering. Premium proxy providers actively monitor node health and prioritise high-bandwidth, low-latency residential peers, retiring nodes that consistently underperform.
Practical Implications for Proxy Users
Understanding how residential proxies work at a technical level directly shapes how you should configure and use them. A few practical takeaways:
For web scraping, rotating sessions with geographic targeting give you the widest IP diversity and the lowest detection risk. Set concurrency limits that respect the target site's capacity. Even with residential IPs, 1,000 concurrent requests to a single domain will trigger rate limiting based on request volume rather than IP classification.
For account management or session-dependent workflows, use sticky sessions with an appropriate TTL. Match session duration to the expected length of the user journey. If a typical login-and-browse session lasts 10 minutes, set a 15-minute sticky session to include buffer time.
For geo-verification and localised content testing, specify country and city-level targeting. Residential proxies are uniquely suited here because the IP's registered location genuinely corresponds to a real subscriber in that area. No geolocation spoofing that sophisticated checks could unmask.
Watch your bandwidth. Residential proxies are typically billed per gigabyte of data transferred, not per IP or per request. Optimise by compressing requests, disabling image loading in headless browsers, and avoiding unnecessarily large response bodies.
The Full Picture: Why Architecture Matters
Residential proxies aren't effective because of a single feature. They work because multiple architectural decisions reinforce each other. The SDK-based acquisition model delivers genuine ISP-assigned IPs. The backconnect gateway makes millions of those IPs accessible through a single endpoint. Protocol support via HTTP CONNECT and SOCKS5 covers every case from simple HTTP calls to complex application-layer traffic. Session management lets you balance between maximum anonymity and necessary continuity. ASN-level IP classification means the traffic inherits the trust level of real consumer internet connections.
Each component is a possible quality differentiator between providers. Pool size and geographic distribution, gateway routing intelligence, residential node reliability and bandwidth, targeting granularity, all of it shapes how well a residential proxy service actually performs. When you evaluate providers, look past the headline IP count and consider the full architecture. That's where the real differences in reliability and detection avoidance show up.